3 ways to measure user engagement with SharePoint Online analytics and best practices
.svg)

.avif)
SharePoint security audit tool
Discover how we can help you manage SharePoint permissions, users, & activity at scale!
Book demo%20(1).avif)
Master Hacks: Migrate like a pro
Check out our video series to help you turn migration projects into masterpieces!
Table of contents
Is your SharePoint site actually bringing value, and are your employees adopting it effectively? Learn three methods for using analytics to ensure your users get the most out of their SharePoint resources.
If you want to know whether your team is successfully embracing SharePoint, dive into your SharePoint usage analytics!
This data can help you understand how users interact with your site. It can also give valuable insights for developing stronger policies and supporting your team before restructuring an environment or after a migration.
Your reports offer critical details, helping you answer questions about day-to-day user behavior, like: How many times have people visited the site and accessed its content? Which files do users view most?
Regularly reviewing these metrics through a mindset of continuous improvement will help perpetually improve how they use SharePoint.
Intrigued? Check out three ways to harness SharePoint analytics to enhance user experience, productivity, communication, and collaboration. You’ll also learn how this data can inform workplace practices —when collecting, tracking, analyzing, interpreting, or taking action on your data. Let’s go!
What are SharePoint analytics?
SharePoint analytics are tools and processes for tracking how people use SharePoint in Microsoft 365. This data paints a picture of how your users engage with content, features, and other functionalities, and can be used to improve SharePoint sites, making them more user-friendly.
There are various SharePoint metrics available, including:
- Site visits
- Unique viewers
- Page views
- Document downloads
- The number of active files
- The number of documents/folders shared externally
- Duration of user sessions/interactions
- User demographics,
- Among others
What information can you get from your SharePoint site usage reports?
And how can you use it to make the service work better for you and your users?
First, your SharePoint analytics can help you determine content relevance and popularity, allowing your organization to gauge the extent to which users engage overall with your pages, news posts, and documents.
Then, you can more efficiently allocate resources, with the ability to organize your site’s popular content to deliver value.
Analyzing individual user activity will also help you better understand which team members need more support. You can see if users comply with your governance policies, aren’t maximizing resources, or need to improve their productivity.
Data points such as which files users view, when they perform specific actions, or which pages they visit, can also inform more targeted training. Then, with specific guidance based on their actual daily activities, users will be more likely to adopt the platform into their workflow effectively.
Efficiency metrics like document access times and version history can help you determine how to streamline processes to improve output. When you look carefully, this information will illuminate performance obstacles, suboptimal user experience issues, cost-saving opportunities, and avenues to solve significant problems before they escalate.
Monitoring usage patterns can also contribute to cultivating a more productive work environment. By analyzing unique viewers, site visits, and average time spent per user, among other details, you can determine better ways for your team to collaborate. And for security purposes, the ability to drill down into the files shared with external users means you’re tracking everything that goes on.
The importance of SharePoint analytics
Your business’s technology should be an asset, not a burden. Thankfully, by understanding your SharePoint Online analytics, you can say goodbye to frustrating obstacles and tailor a more harmonious work environment that unlocks the platform’s full potential.
Below, we’ve listed some critical ways your SharePoint sites can benefit from a deeper dive into the statistics. And for bonus material, when you’re done, explore our guide to leveraging your SharePoint usage reports.
Enhancing user experience
Relying on assumptions is never a good idea in business. By using your SharePoint site analytics, your organization can make data-driven decisions that actually improve user experience.
Monitoring and analyzing user behavior will identify pain points that hold back productivity. Then, your organization can address those specific bottlenecks to ensure users are satisfied with the environment. For example, tracking load times and response rates will help finetune site performance, so users can get their work done in a frustration-free environment.
The insights from your reports also allow you to personalize your SharePoint content. So, your users will get a more relevant and engaging experience, making it likelier that they’ll maximize the tools on the platform.
Increasing productivity and collaboration
Technical issues or poor governance can bring work to a grinding halt and prevent employees from accessing the critical resources they need.
Yet when you proactively rely on your analytics reports, you can investigate and unroot any potential issues – before they cause a problem. The information in your reports will provide insights into developing the most effective long-term solutions for any roadblocks affecting a department’s productivity. It’s also about identifying areas for collaboration enhancement! Being able to find content seamlessly makes teamwork a lot easier and more pleasant.
For example, you may use SharePoint search analytics to conduct an information architecture assessment to see how you’ve currently approached file organization or do a metadata analysis to see how you classify your content. This may reveal ways to tweak your SharePoint metadata for a more efficient user search experience.
Method #1: Use built-in SharePoint site usage reports
Microsoft 365’s out-of-the-box reports offer some helpful information for improving adoption and maximizing business impact. They display several statistics on how site visitors interact with a site’s content, like ‘most viewed items’ or ‘most active users.’
How do I see site analytics in SharePoint?
To get the SharePoint site usage report:
- In the admin center, go to Reports, then click on Usage
- From the dashboard homepage, under Reports, select SharePoint
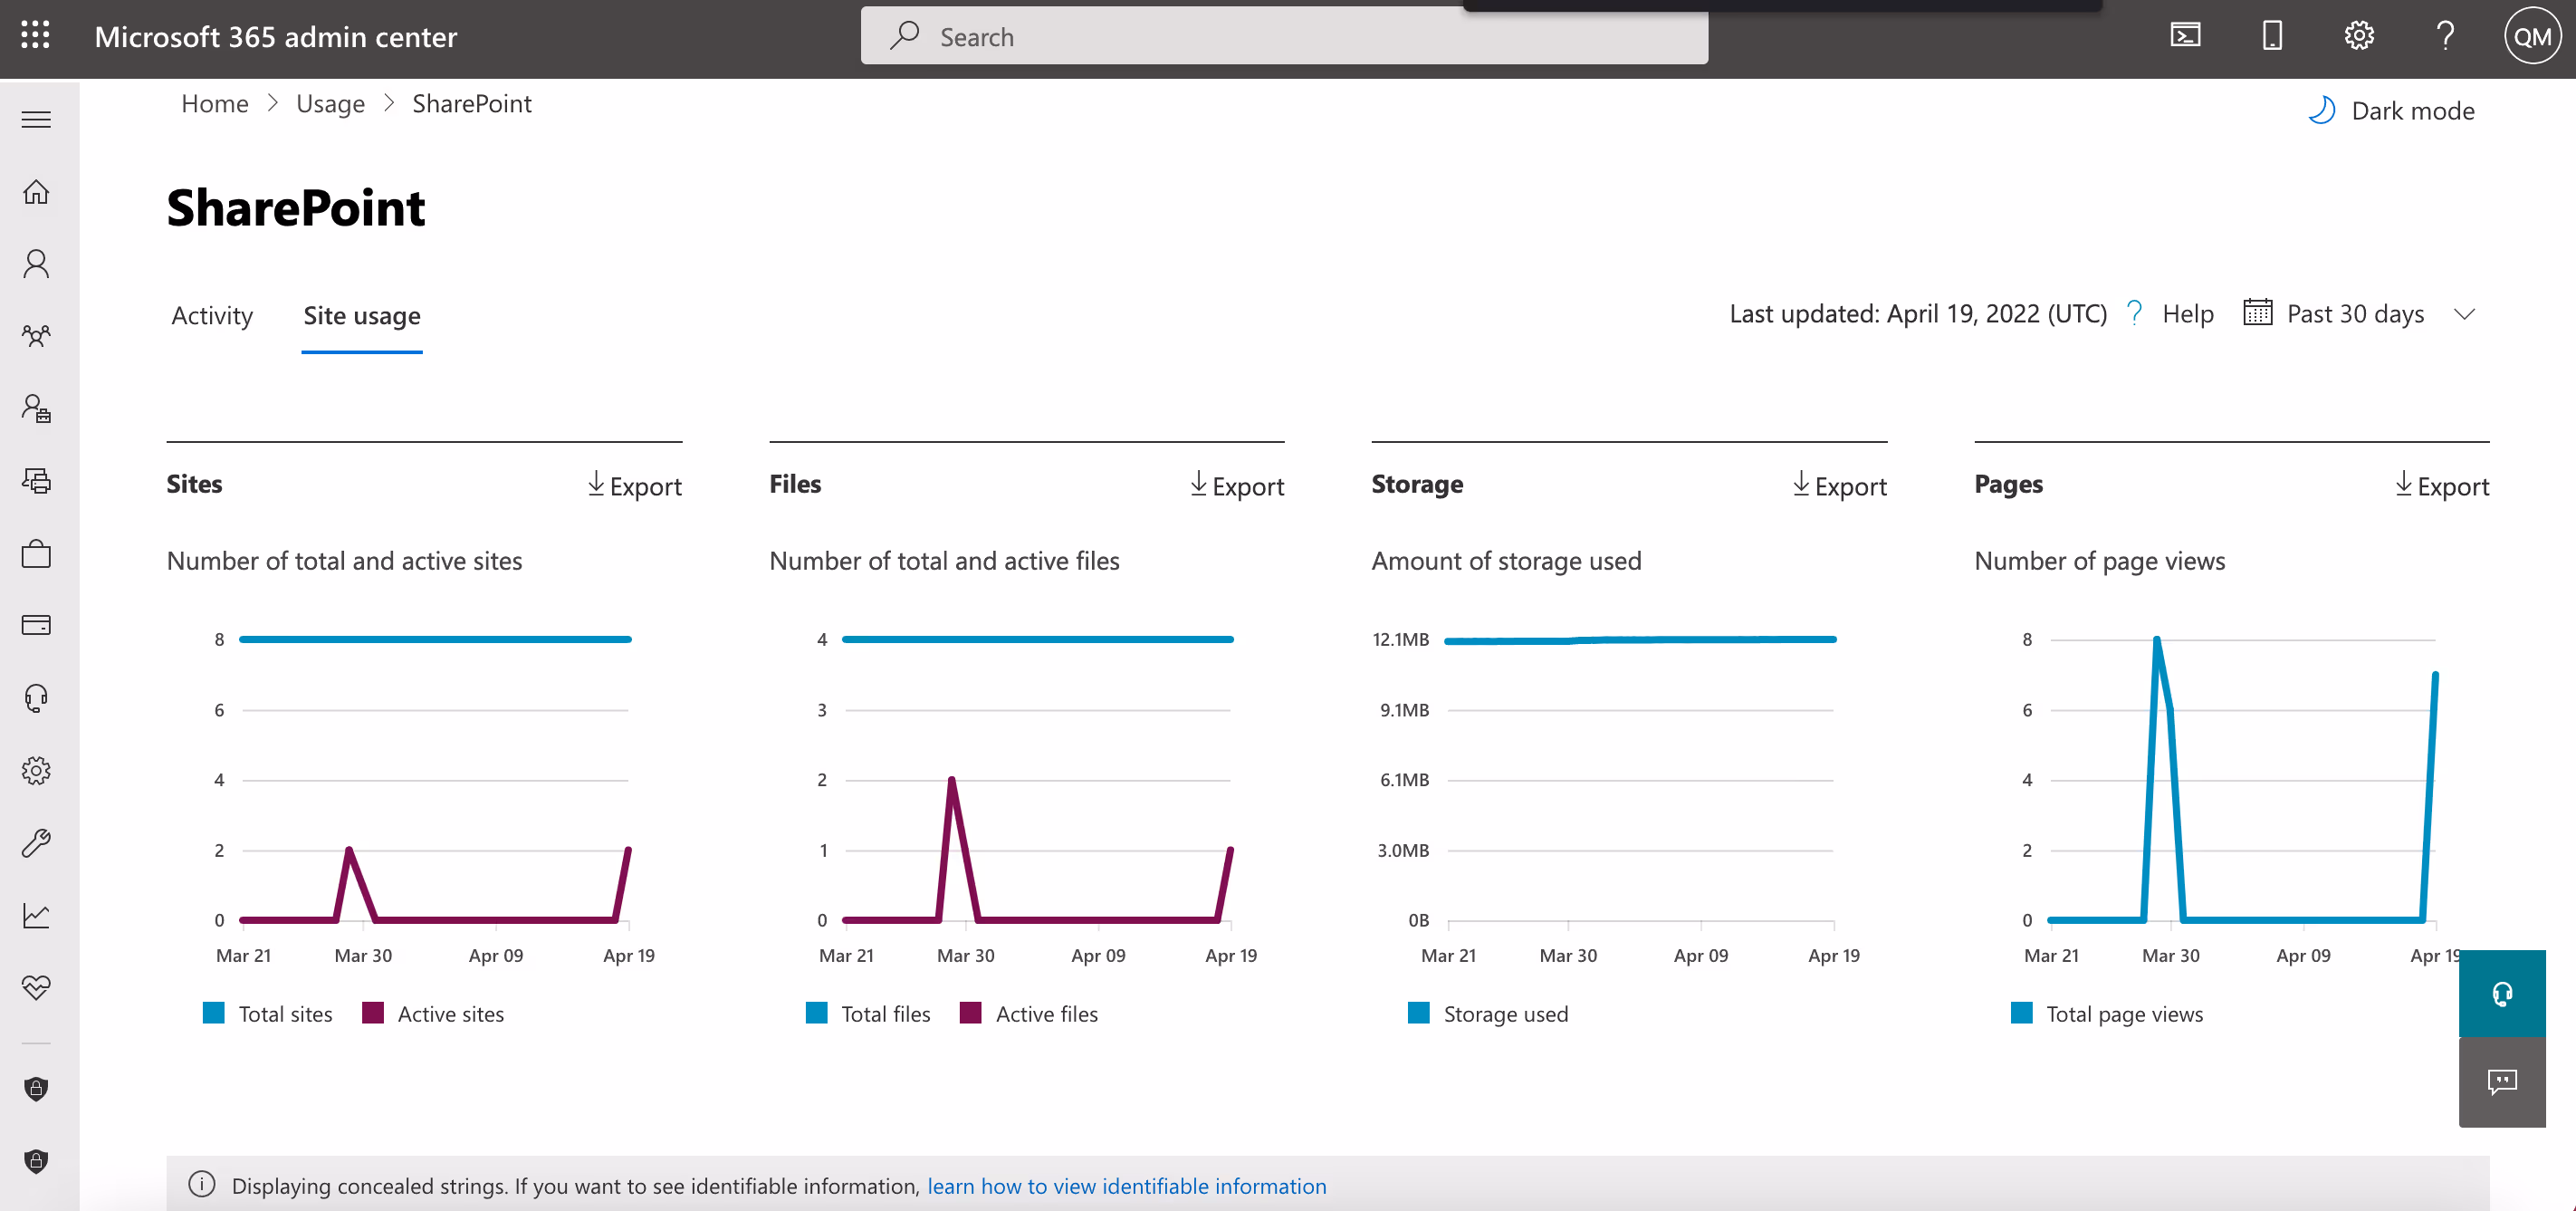
You can view the site usage in the SharePoint report by choosing the Site Usage tab.
Your usage list will look something like this.

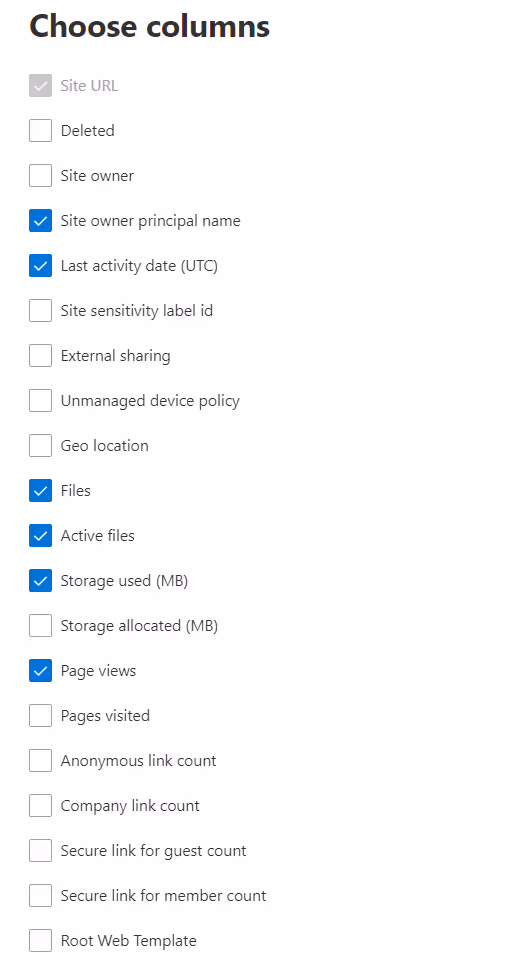
You can select Choose columns on the right-hand side to add more information to your report, such as external sharing, pages visited, active files, the sensitivity label on the site, and more.
Method #2: Ask your team
While the built-in SharePoint Online analytics provide basic adoption metrics, chatting directly with your actual users can also help you assess your environment’s effectiveness.
Understanding your user engagement can be as simple as consulting site managers. Or, you could create a short survey to discover how your team uses and interacts with your site. Ask questions like:
- What are the top queries on my site per day/per month?
- How many search queries are users performing on average?
- Which queries receive low clicks, and why?
- How often are people clicking promoted results?
With the survey answers, you can create a plan to manage sprawl and increase adoption. Seeing common themes emerge (e.g., a site no one uses) will help you make more informed decisions in that process.
Sprawl refers to the staggering amount and variety of data produced by enterprises each and every day. As data sprawl out of control, it makes it harder to protect, much less leverage, if you don’t know where it is.
Method #3: Use third-party SharePoint reporting tools
SharePoint usage reports provide limited data. If you want deeper reporting options, consider third-party solutions like ShareGate!
ShareGate lets you run and automate custom and pre-built reports to monitor, organize, and secure your SharePoint and Teams environments.
See who (and which groups) can access what, including external users and content shared via anonymous links–using the Permissions matrix report from the migration tool.
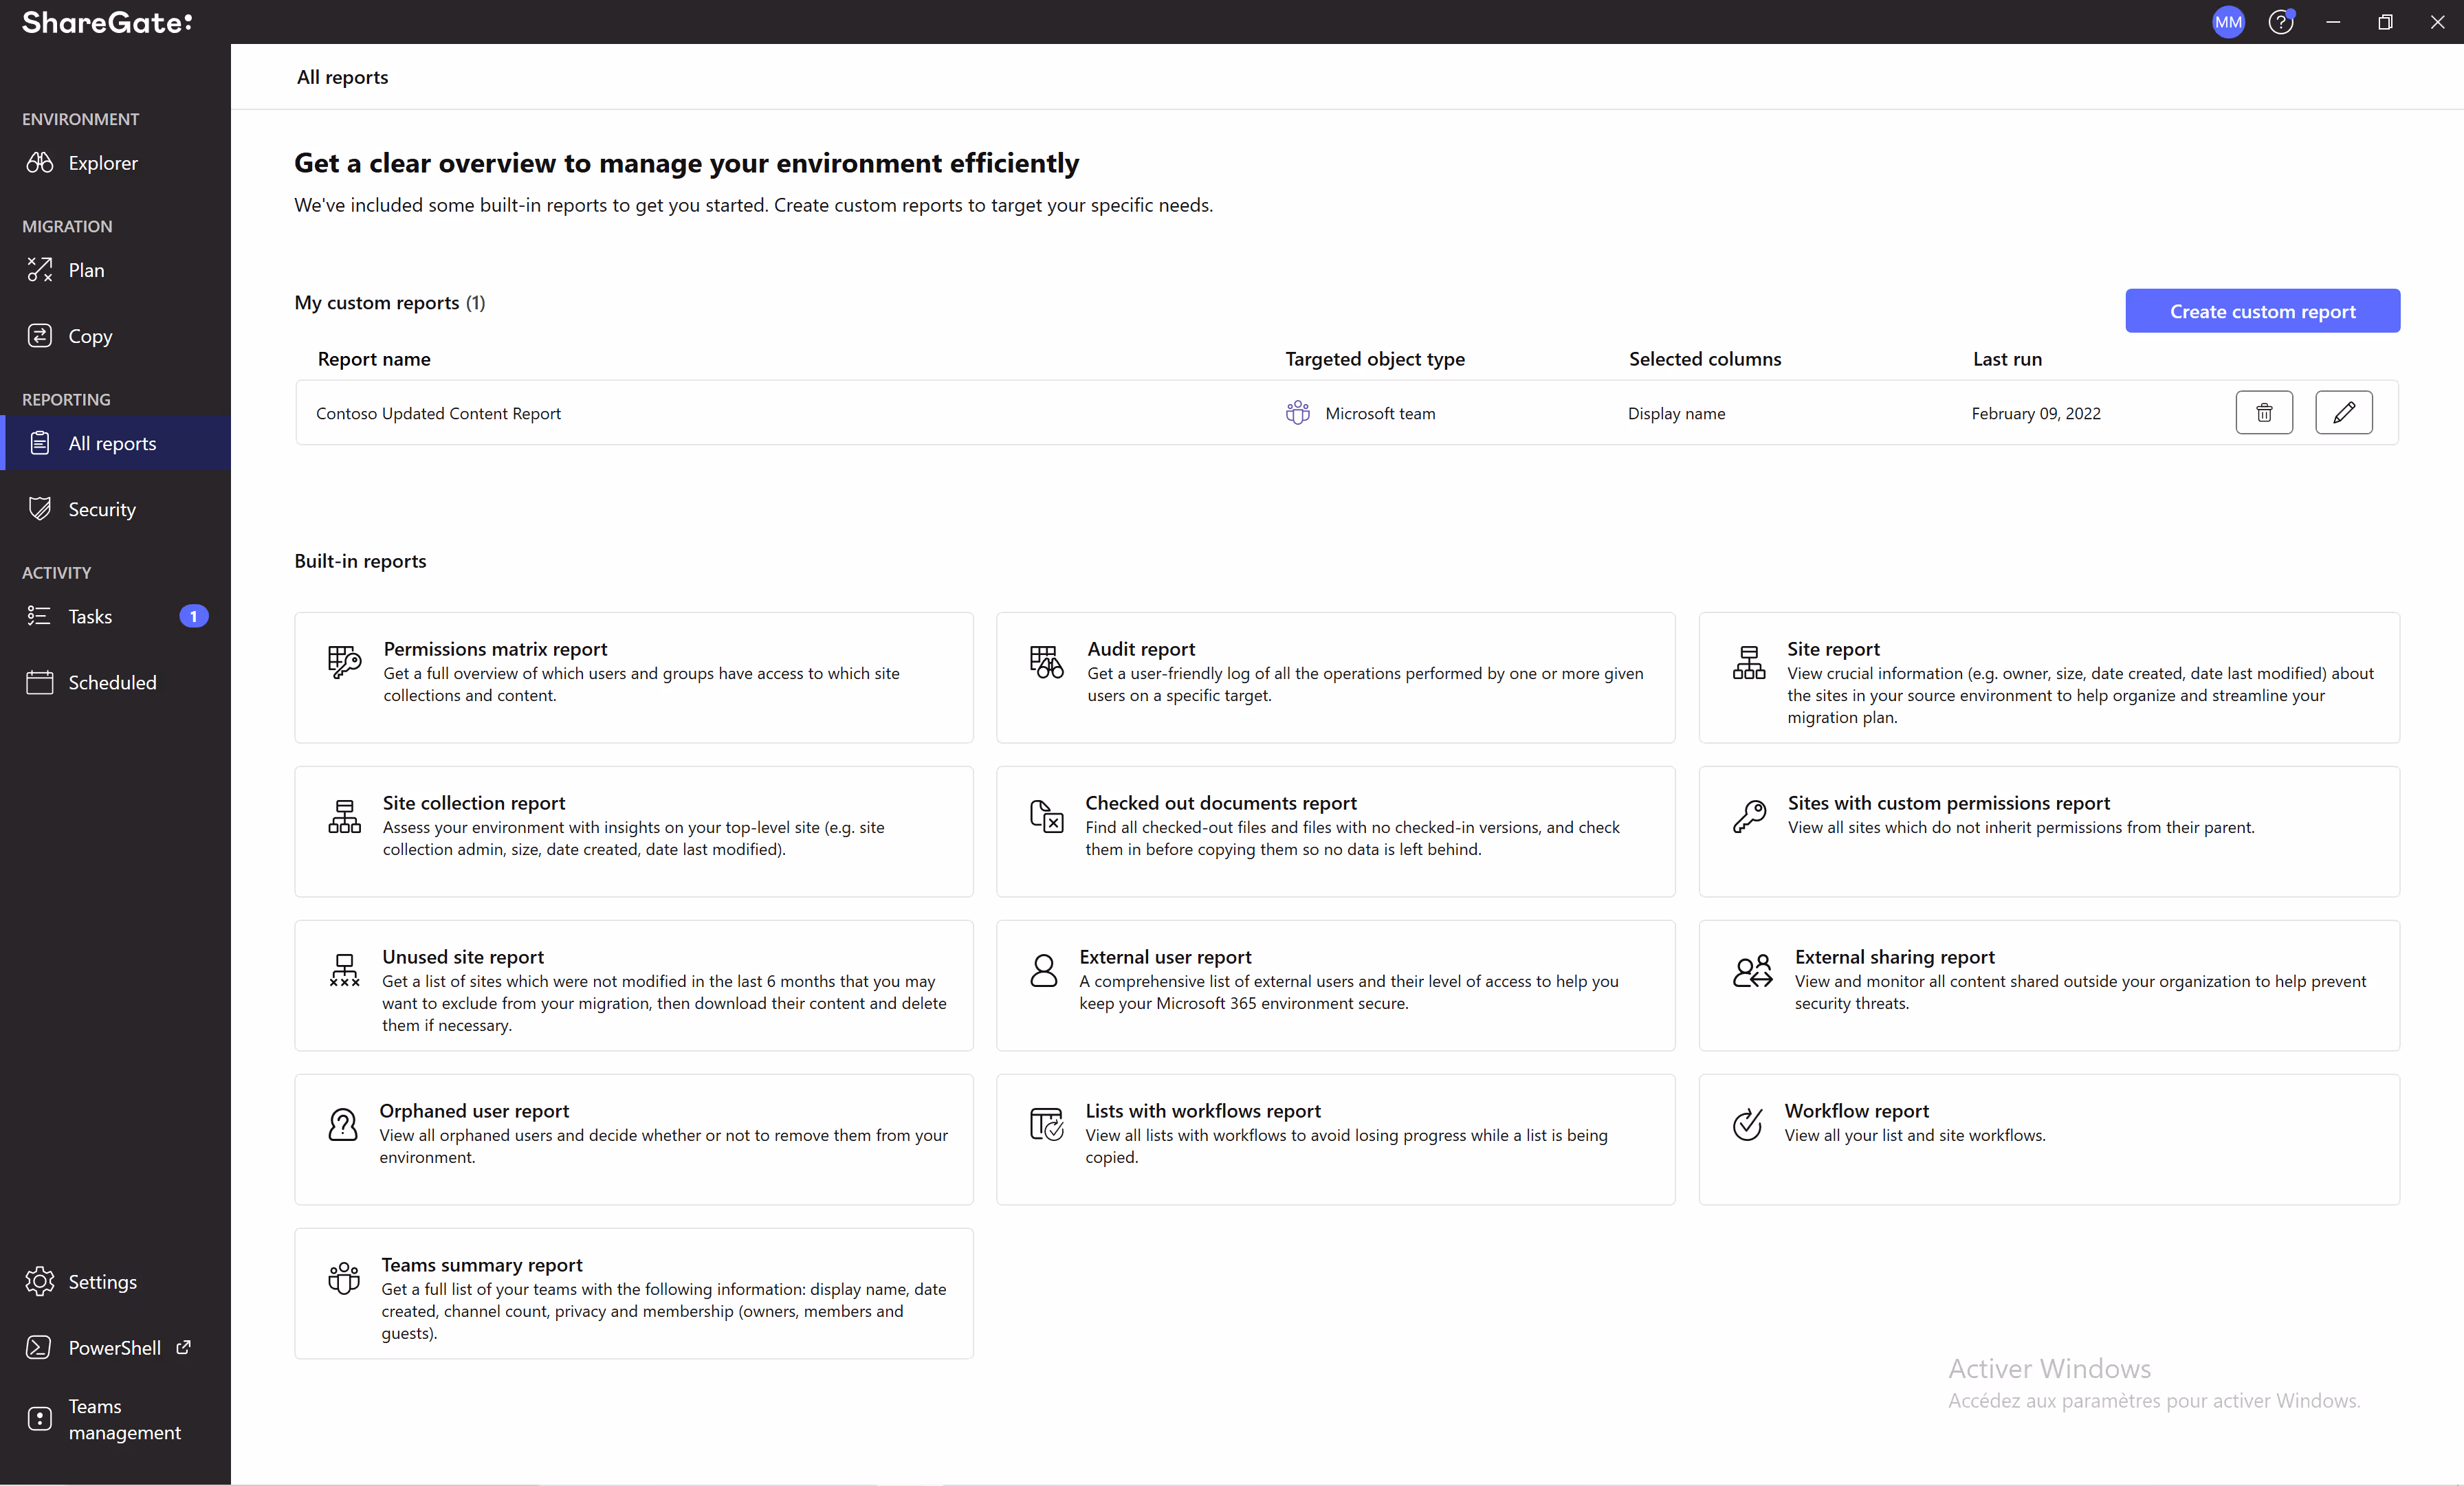
The Activity log report gives better visibility into who did what and when, allowing you to monitor your teams from creation to sunset.
You can also run the External Sharing Report from the migration tool or create a custom report to target documents with organizational links and get a listing.
Finally, your organization will benefit from using our other built-in reports for your migration projects and everyday SharePoint and Teams operations.
B
Best practices when handling SharePoint site usage data
Effectively harnessing your SharePoint data will let your organization optimize how you collaborate and manage documents online. Start with these best practices to maximize your site's potential:
Define clear objectives
Focusing on how you collect/track data is crucial for performance optimization. You can’t uplevel your organization’s SharePoint site usage if you don’t consider the data’s long-term and holistic impact on your goals.
To act on the information, you’ll need to define clear objectives. Start by identifying what specific usage data you want to collect, based on its relevance to your business’s key performance indicators. You want to look at SharePoint web analytics that can help form concrete strategies and policies, such as page views, site traffic, unique visitors, document downloads, and user engagement.
Once your organization establishes these goals, implement a proper tracking system. Ensure you correctly set up your tracking mechanisms and consistently maintain them across all SharePoint sites.
Remember, throughout this entire project, don’t neglect your privacy and compliance! Whenever you handle data, you must prioritize adhering to data privacy regulations for your industry — -- including ensuring you aren’t inadvertently exposing sensitive information.
Analyze data
A well-designed data analysis strategy is key for accurately interpreting how users interact with your SharePoint sites and site collections. So, what should it include?
First off, benchmarking will be critical! Regularly comparing your data against industry standards or internal goals can help you measure progress.
Integrating qualitative user feedback with quantitative data will also be necessary to get a more all-encompassing view of site performance. You’ll get the findings you need to create a user-centric platform that fully empowers your team to use SharePoint in their daily routines.
Predictive modeling and analytics will allow you to forecast future usage trends. Whenever engaging in data analysis, you should consider how your current data points can help you proactively anticipate and then prevent potential issues.
Finally, you can also use data visualization to transform raw data into meaningful insights. Visual formats like charts and graphs help demystify complex numbers into a compelling story. Luckily, Microsoft makes this more accessible by providing seamless SharePoint integration with Power BI, their interactive software for visualizing business intelligence.
Run regular reports
Regular reporting is critical to distinguishing patterns in your data. It allows for trend analysis, helping you identify your user’s pain points and preferences over time. Then, you can make changes to create a more intuitive and satisfying environment. These period updates will also help you tailor your content usage strategy based on insights that reflect your most recent SharePoint document analytics and other key metrics.
When developing your reporting process, establish mechanisms for sharing reports with relevant organizational stakeholders so they stay updated on key usage metrics and insights. You’ll also need to provide support and customized user training on how to use this data.
Most importantly, your data optimization strategy should prioritize security and access control. Make sure that your access and permissions align with current usage patterns and document activity. And review and adjust those permissions as necessary to keep your data secure.
Want to know more about how to collaborate securely in SharePoint? Check out SharePoint permissions best practices.
Use the SharePoint site usage report to generate productivity
Developing a successful SharePoint strategy requires understanding user behavior. When equipped with real data, you can take actionable steps to optimize how users use SharePoint to support their day-to-day work.
Whether using information gleaned from the built-in SharePoint site or consultations with your team, focusing on concrete numbers and patterns will be a game-changer for collaboration.
And when you use a third-party SharePoint reporting tool like ShareGate, you can gain even deeper insights into how your users navigate the environment. By following our best practices for effectively collecting, tracking, analyzing, and interpreting your data, you’ll see that information transform into real positive change for your organization.
FAQ
What is the best tool for SharePoint analytics?
There are various SharePoint analytics tools, each with its own distinct benefits and potential drawbacks.
SharePoint's native analytics tools are straightforward and don’t require administrators to configure an extra setup. Upfront, these tools are more cost-effective since they come bundled with SharePoint already.
However, its out-of-the-box reports provide limited information. The platform restricts your ability to get metrics for certain time periods, there are fewer options for customization, and there's no audience segmentation.
Have you thought about using a third-party solution to gain more valuable analytics? You might be on to something! For example, ShareGate offers centralized and actionable that monitor your environments, No need to build scripts or jump from one Microsoft 365 admin center to another! Just go from insights to resolution from one location.
Can you add analytics to SharePoint?
You can’t add additional metrics to SharePoint’s native reports.
However, you can integrate a Google Analytics plugin to get more detailed insights about your pages (but not on your document activity!). Also, Google didn’t design its analytics tool to work for private intranets, meaning you may encounter data privacy issues. Also, it just can’t provide sufficient insights about your team’s collaboration.
However, ShareGate is built to work with SharePoint. You can create a custom report from scratch with highly refined data targeting, looking at everything from your permissions to your orphaned users. ShareGate also offers extensive options for setting multiple filters and conditions to get unique insights.
Can you create a dashboard in SharePoint?
Microsoft provides several dashboard creation tools within SharePoint that allow you to display reports and information. You can use Power BI, display a workbook in an Excel Web Access Web Part, showcase an interactive chart on a single SharePoint page, or create a status indicator as a scorecard or report.
However, this requires a lot of tinkering—and it’s not designed specifically for your SharePoint usage metrics. There's no simple way to visualize SharePoint statistics about your usage. The admin center’s limited dashboard provides basic information, and you need to access various tools to gather necessary information. On the other hand, ShareGate's custom reports provide more comprehensive visibility of all user activity tracking, with the option to add widgets for greater dashboard relevance.
Can SharePoint generate reports?
Yes, SharePoint can generate reports - but it requires manual labor and the options are limited. You can schedule reports to occur at specific intervals, and then export the data to an Excel file. However, you can’t automate this process. Instead, you’ll need to access the admin center at each individual site. You can use Power BI for a work-shift automation process, but that requires more coding.
Luckily with ShareGate, you can leverage a hands-free insights generation tool for understanding your various analytics for SharePoint. You can automatically generate reports and export them to a designated SharePoint library.
Who can see page analytics in SharePoint?
It depends on the permissions granted to users or groups within the SharePoint site. Typically, users with certain admin or editing privileges can view page analytics, while others might not have this access.
- Site admins: have full access to site data and analytics
- Members and Owners: typically have access to site analytics and usage data
- Visitors: can access some site data but usually can’t download site usage reports
- Guest users with site owner permissions: typically can’t access site analytics or usage data