.svg)

.avif)
Microsoft 365 governance made simple
Fix what matters, faster, without complex rules or tool switching!
Free trial%20(1).avif)
Master Hacks: Migrate like a pro
Check out our video series to help you turn migration projects into masterpieces!
Table of contents
Learn the ins and outs of Power BI SharePoint reporting and Power Automate, and step-by-step instructions on creating a Power BI dashboard using data from your SharePoint environment.
As an IT pro, you know how crucial it is to understand your Microsoft 365 environment and keep it under control. The goal is always to find and fix issues before things go sideways—this requires a proactive approach and isn’t possible without optimal visibility.
Enter Power BI SharePoint reporting and Power Automate, a dynamic duo.
Power BI is a user-friendly data visualization and reporting tool created by Microsoft. It’s especially useful to report on SharePoint folders and lists regularly—which is a great way to ensure end users are adopting a tool and using it properly.
You can configure Power Automate to automatically send the data to Power BI—trust us, this will open up a whole new world for you.
At the end of the day, SharePoint—and the entire Microsoft 365 suite of productivity tools—is a collaborative platform. With a wide variety of offerings, it can be easy to overlook some of the best ways to use SharePoint; its usefulness ultimately depends on how business users use it daily.
In this post, we’ll:
- Introduce you to Power BI and cover some reports that can easily complement ShareGate’s built-in reports to gain full visibility on your SharePoint environments.
- Teach you how to configure Power Automate to send relevant data to Power BI automatically.
What is Power BI?
Before we jump into anything, it’s important to explain what Power BI is and how it can help you.
Power BI is a data visualization tool. It provides cloud-based business intelligence (BI) services, as well as a desktop-based interface—both of which enable you to create your own reports and dashboards for custom visualizations.
The Power BI service offers both free and paid license options. Paid options include Power BI Pro per user, Power BI Premium per user, and Power BI Premium per capacity. Power BI Desktop is always free.
If you’re familiar with reporting tools already, it’s important to note that this is nothing like SQL Server Reporting Services (SSRS). Power BI offers a gorgeous user interface and is much easier to use. With just a few clicks, you can publish your dashboards and reports online and to any Microsoft 365 group.
Top benefits
- Power BI Desktop is always free. Yes, there are pro and premium versions that allow users to present even more data, but you should be just fine with the free version for most of your reports.
- There are close to 65 different data sources available that can be integrated into Power BI. From an SQL database to third-party tools like Salesforce, Google Analytics, and others.
- No coding necessary. You can configure your data using simple operations—or use Simili-Excel operations for even more flexibility. These are called DAX basics operations.
- Sharing dashboards has never been easier. Sharing options are easy to customize. You may want to share dashboards with one person or everyone in a Microsoft 365 group. You can even share your dashboards with guests. Plus, the online versions are all accessible through your Microsoft Services page.
Why you should use Power BI with SharePoint
Many organizations choose to build a modern intranet on SharePoint in Microsoft 365. That’s why it’s so useful to create reports on its usage, and also to store the subsequent Power BI reports there.
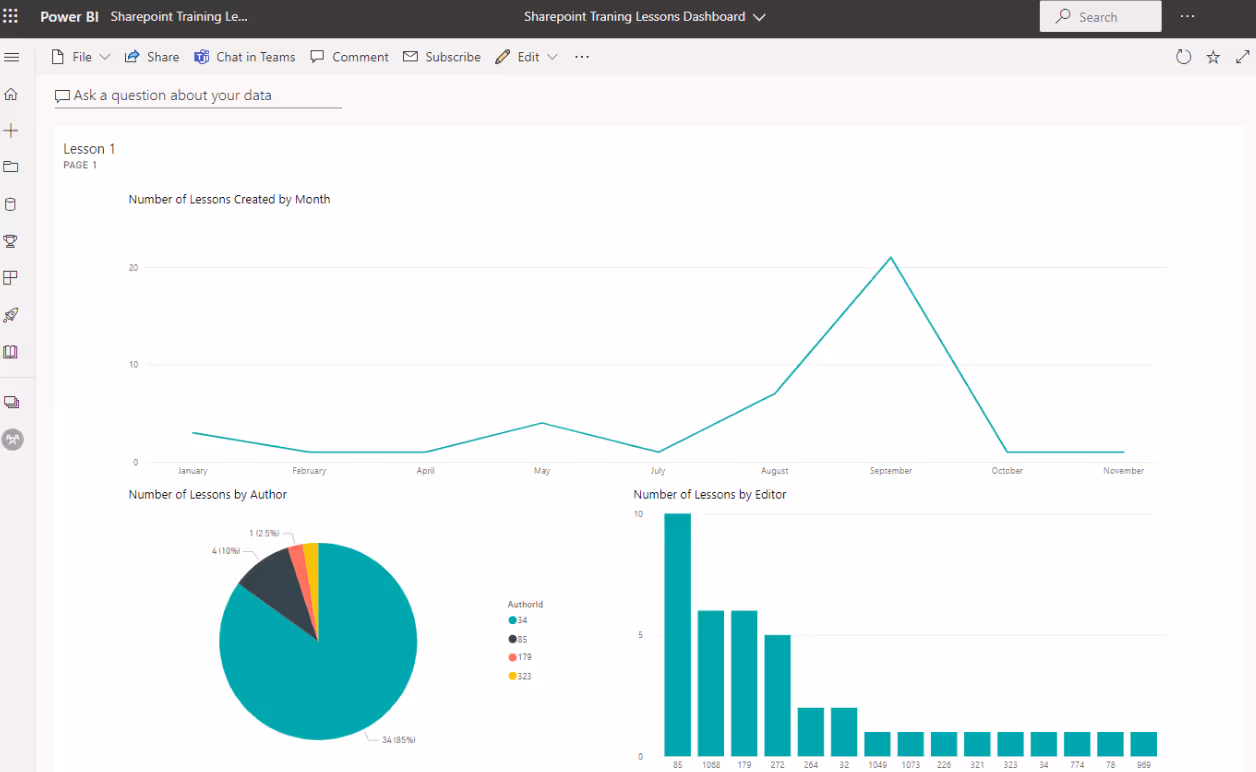
For example, at ShareGate, every employee goes through rigorous training on how to use our tools. We use a custom Power BI dashboard to monitor the lessons being created and updated on the ShareGate team site—that way, we can make sure employees are constantly collaborating to keep the training material current.
Here are step-by-step instructions to produce a Power BI dashboard using data from your SharePoint environment:
How to create a Power BI dashboard

Step 1: Download Power BI for Desktop
Although Power BI has two versions (online and for desktop), we suggest starting with the desktop version to create the dashboard since it’s free. Then you can publish it through Power BI Online to share it with your colleagues.
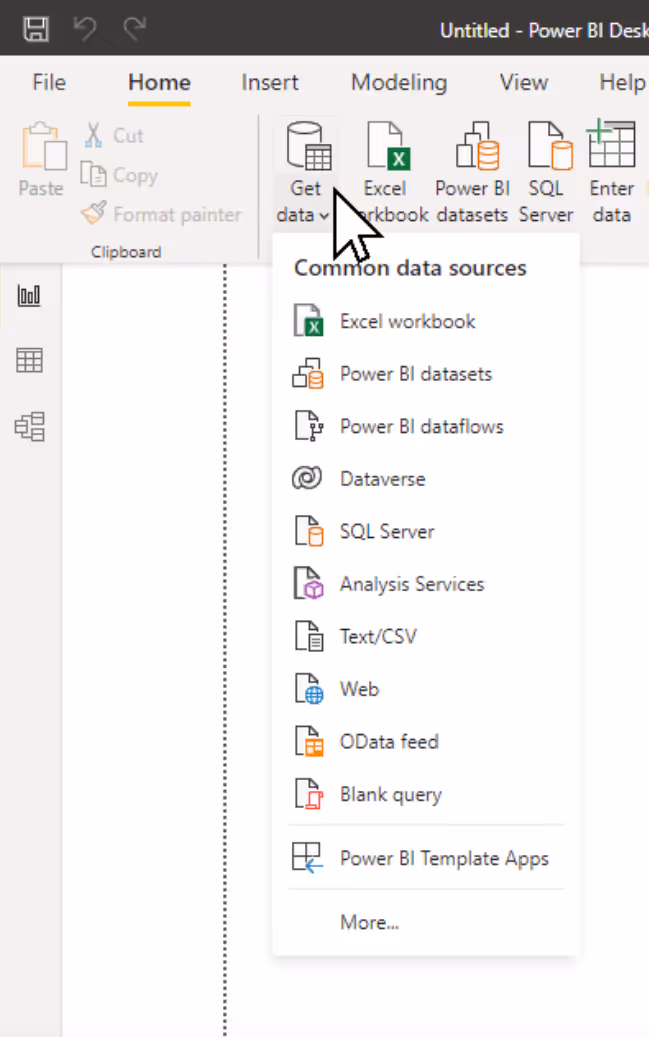
Step 2: Get data from SharePoint
Once Power BI is open, click the Get Data button from the Home tab on the ribbon to access the available data sources.
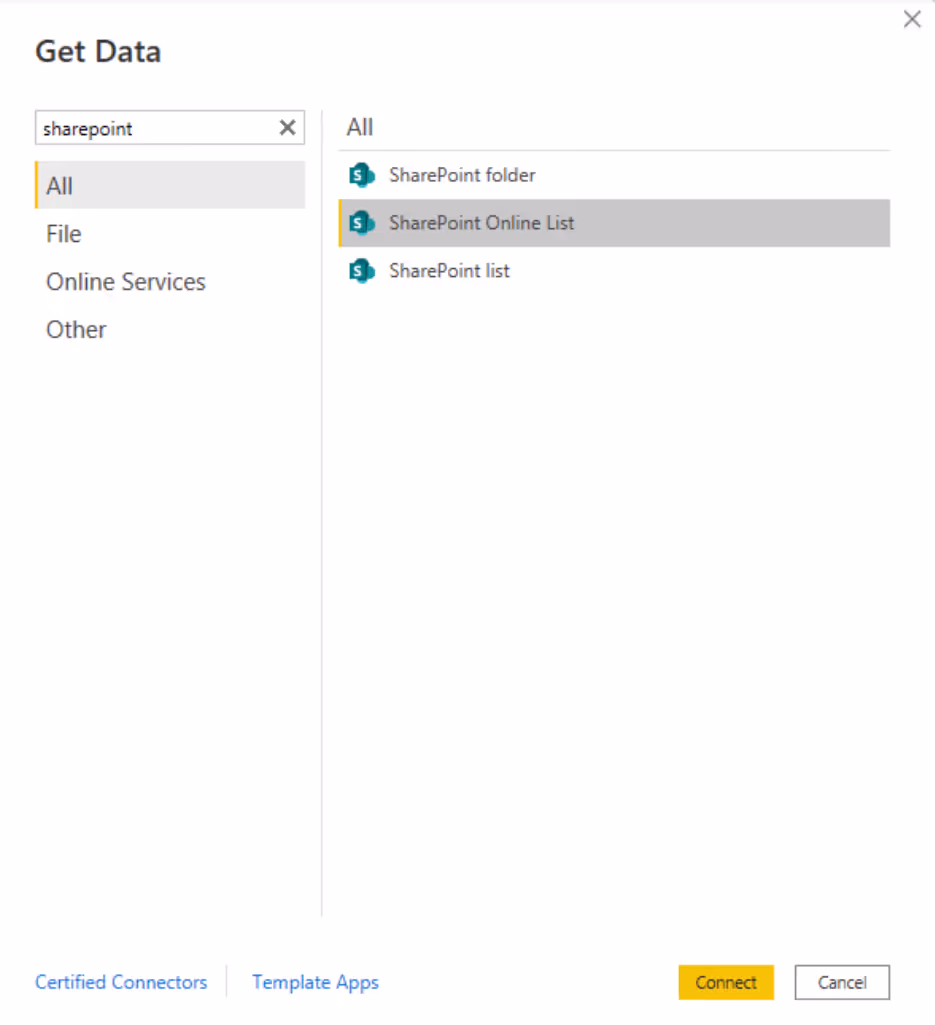
Step 3: Select the right data type
You should see three types of available SharePoint data connectors:
- Folders
- Online lists
- Regular lists
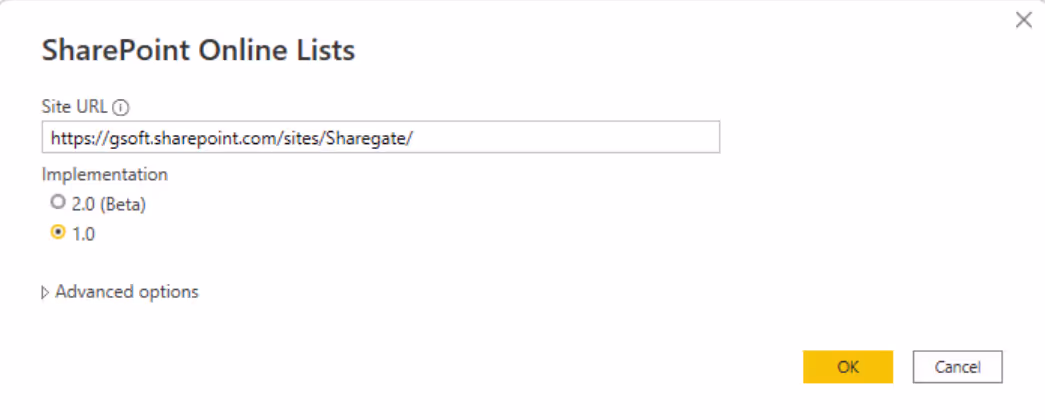
Pick your object type and add your SharePoint URL.
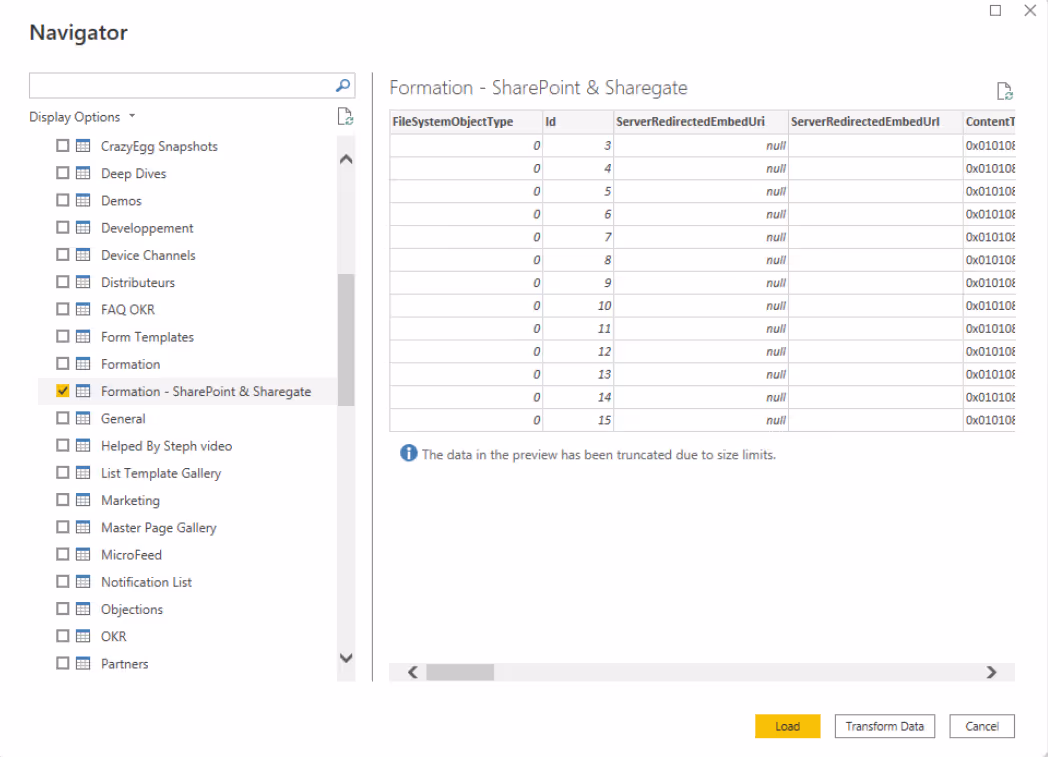
Step 4: Load your data
On the left side, select the relevant folder or list. A preview of the data that can be loaded should appear in the Navigator window.
Step 5: Edit your query to make good visuals
Before loading the data in Power BI Desktop, you might want to adjust or shape the data.
It’s an especially good idea to edit a query before loading when working with a large data set. You can do this by selecting Edit, and then making further adjustments in the Query Editor.
The Query Editor is where you shape the data to meet your needs—for example, to keep the data that will create impactful visuals and remove irrelevant data.
You can do this by:
- Shaping and combining data
- Grouping rows
- Pivot columns
- Creating custom columns
For a full list of query tasks and instructions, check out the official Microsoft documentation.
Step 6: Publish your report to Power BI Online
When satisfied with your visuals, publish the report to Power BI Online by clicking on the Publish button. If you haven’t activated Power BI in Microsoft 365, you’ll be asked to activate it.
You have the option of publishing your report in your workspace or any of your Microsoft 365 Group workspaces.
Tip: We suggest creating new designated workspaces if you plan on sharing your dashboard with colleagues. This gives you more control over who has access to your dashboard, and also lets you collaborate with colleagues. Read about how to create a new workspace experience in the official Microsoft documentation.
Step 7: Find your published report on Power BI Online
If you go to the Power BI home screen and log in, you should see the report in the recent activity section. You can also look at the whole workspace where the report was uploaded—use the left sidebar for easy navigation.
This section shows you basic information and options related to the workspace. You can manage the content, settings, and access details of the workspace. You can also create/update an app based on the items in the workspace.
In this section, you can also use the view options and filters to browse through the workspace’s items. The typical items you’ll find in a workspace are:
- Dashboard: A dashboard is the high-level view of the report you just created. You can transform your report by pinning reports tiles.
- Reports: This is what is being published from Power BI Desktop. To transform this report into a dashboard, you need to pin the tiles into a dashboard.
- Datasets: This is your source data. To make the data dynamic, you need to go to this section and schedule automated refreshes
Step 8: Transform your report into a dashboard
This part is pretty straightforward.
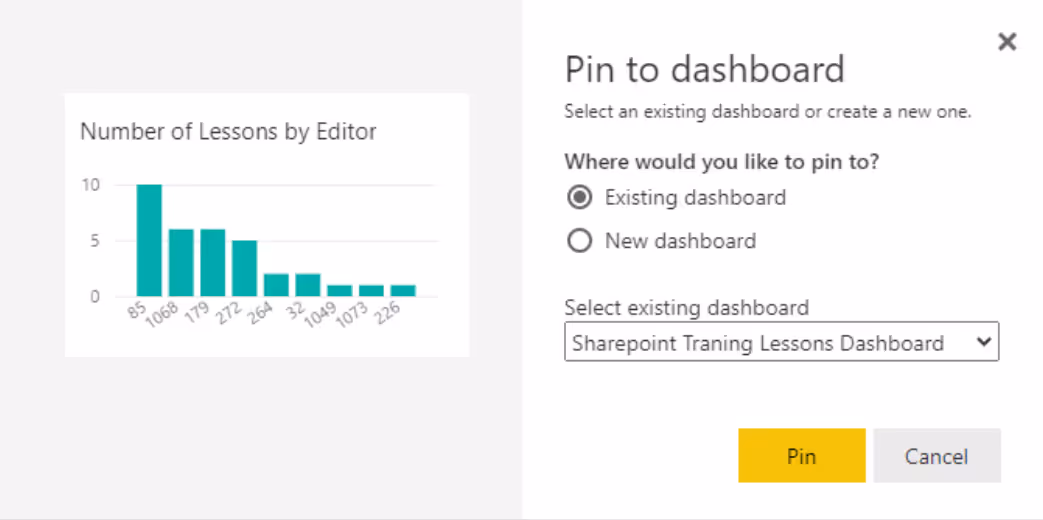
All you have to do is access your report and click on the pin icon.
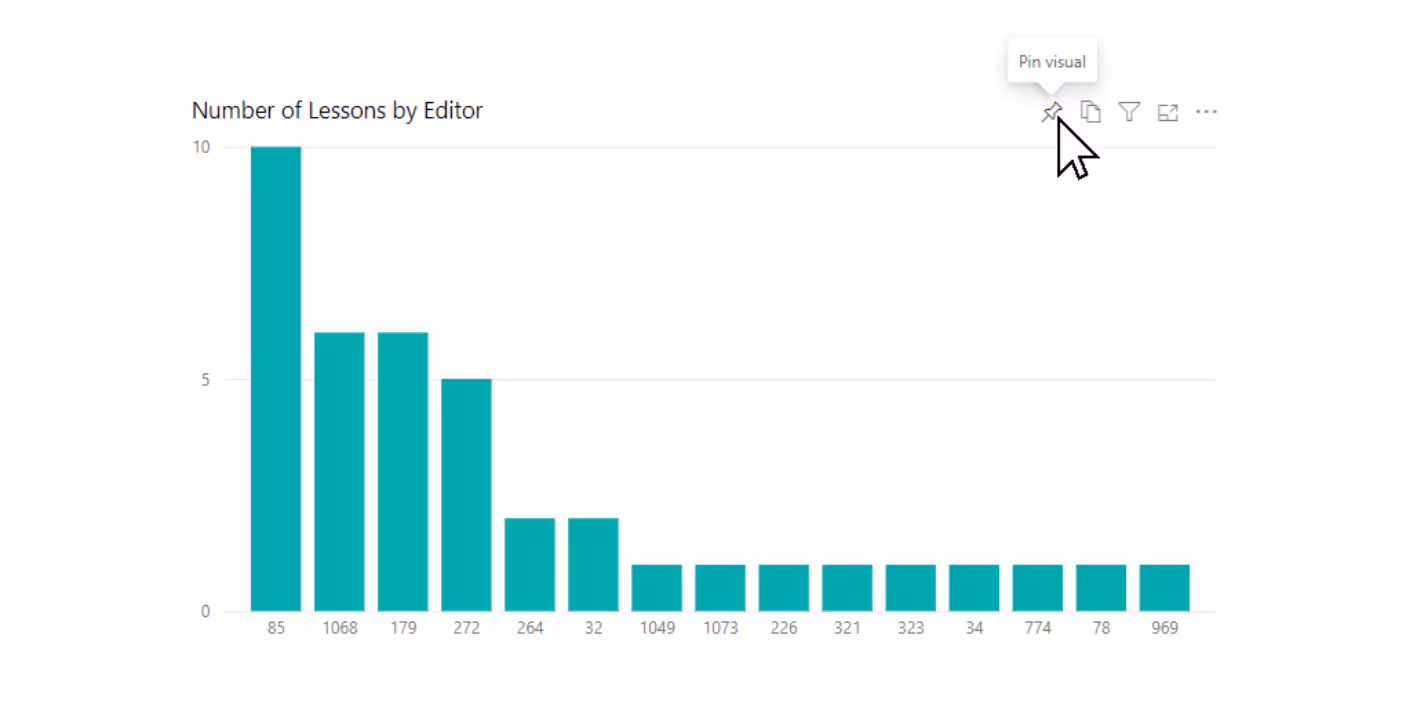
Then, you can select or create the dashboard you want your visual on.
Step 9: Schedule an automated refresh
This step is very important. If you don't do this, your dashboard will never refresh.
Go under the Datasets + dataflows section, find your dataset and click on the Schedule refresh button. You’ll have the option to enter your credentials and select the refresh frequency.

Step 10: Share your dashboard
You now have a fully functional, automatically refreshing dashboard that can be easily shared!
If you create a designated workspace, you'll need to grant access to users. Then, you can ask them to connect to Power BI Online, or you can simply send them the URL—and voilà!
Can you schedule Power BI reports?
Power BI is a powerful SharePoint online reporting tool that offers a variety of insightful reports, but it can be cumbersome to manually request the same reports over and over. Thanks to Power Automate, this is a non-issue as it allows you to schedule automatic export and distribution of any Power BI report.
Making this happen is simple: create your own flow from scratch, and then use the Export to File for Power BI Reports action to automatically distribute the Power BI SharePoint report of your choosing via email.
Check out the official Microsoft documentation for step-by-step instructions to schedule a Power BI report.
Is SharePoint a reporting tool?
This question has a complicated answer. On one hand, it's possible to access reports on SharePoint activity through Microsoft 365 directly. On the other hand, doing so manually can be difficult and inefficient.
Microsoft 365’s reporting solutions have become much more user-friendly than in the past when PowerShell was the only option for reporting. Now, you can access a wide range of instantly-available reports from the Microsoft 365 admin center, providing out-of-the-box features to access info about activity and usage. And if you want more reports on SharePoint sites, you can search the audit log in the compliance center.
The problem is that much of the info you’ll be looking for is scattered around different admin centers, and it’s time-consuming to get the actionable insights you need. You have to actively look for problems in your environment through Microsoft’s reporting options (they don’t just reveal themselves).
Have you considered a third-party SharePoint reporting tool to help you manage your environment or plan a migration? You might be on to something.
ShareGate gives you centralized, actionable reporting capabilities. Your IT team can access custom and pre-built reports to get the insights needed to pinpoint issues and take direct action to customize and fix them—fast.
What is Power Automate
You may know this tool as Microsoft Flow, but it was rebranded to Power Automate.
While the name has changed, it remains a SaaS that automates workflows across many applications and services. These automated workflows (called flows) are triggered to perform different actions automatically when a specific event occurs.
With Power Automate, you can automate repetitive tasks to get notifications, synchronize files, collect data, and more.
Related: 6 Power Automate examples to level up your automated Teams management
How do Microsoft Power Automate and Power BI work together?
Power Automate collects our SharePoint data for us, then sends that data to Power BI—all without needing to write a single line of code!
To get a good sense of this Power Automate’s functionality, let’s continue with our example above, where we set up a Power BI dashboard using data from SharePoint, and go one step further by bringing Power Automate into the mix.
How to use Power Automate
- Navigate to the Power Automate homepage. If it’s your first time, create an account—there’s a free plan that lets you try out the service.
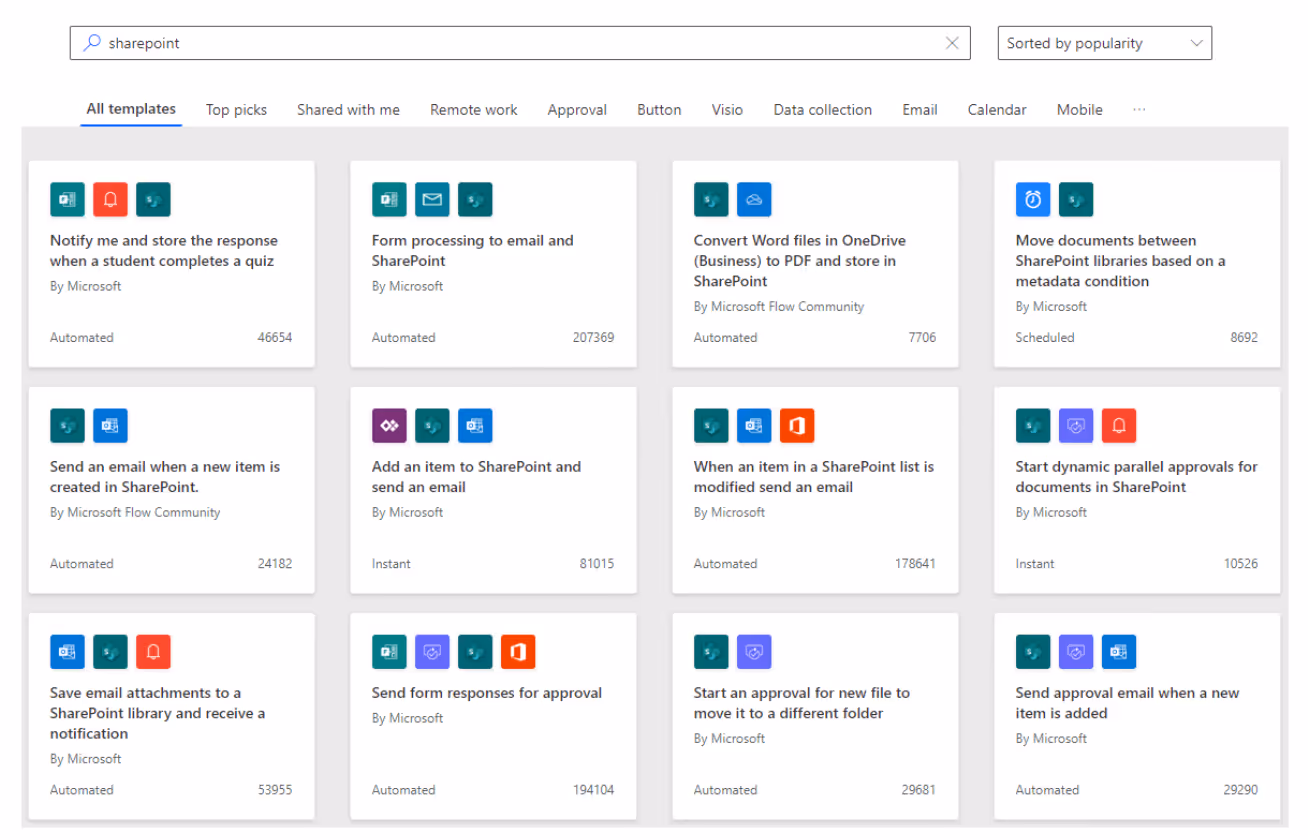
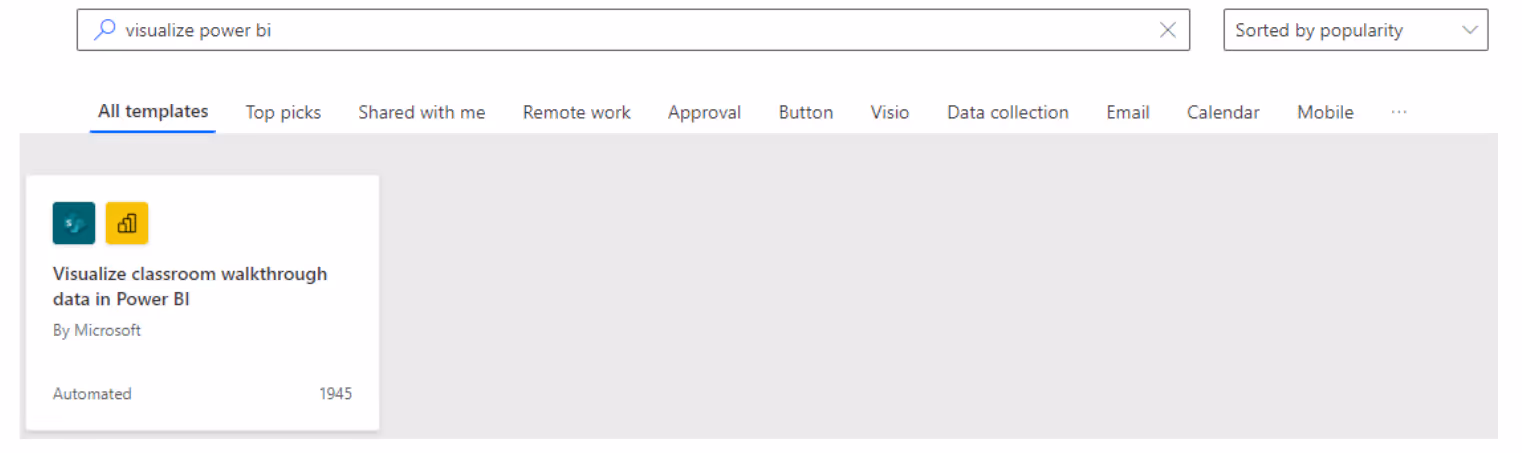
- Perform a search to see if an existing flow template can accomplish what you want. You don’t want to create a new flow from scratch if you don’t need to. Let’s do a search for “SharePoint.”
Hmm… nothing is quite right. Let’s try searching for “visualize power bi.”
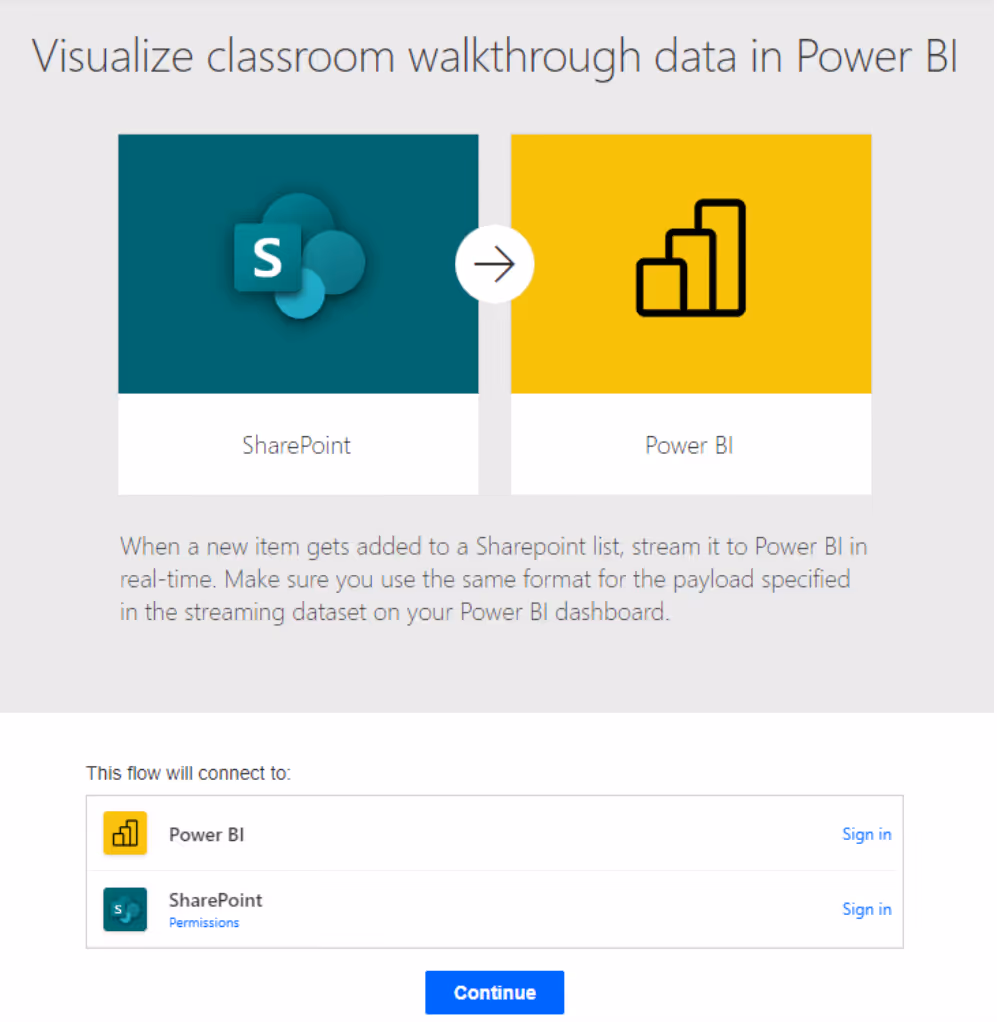
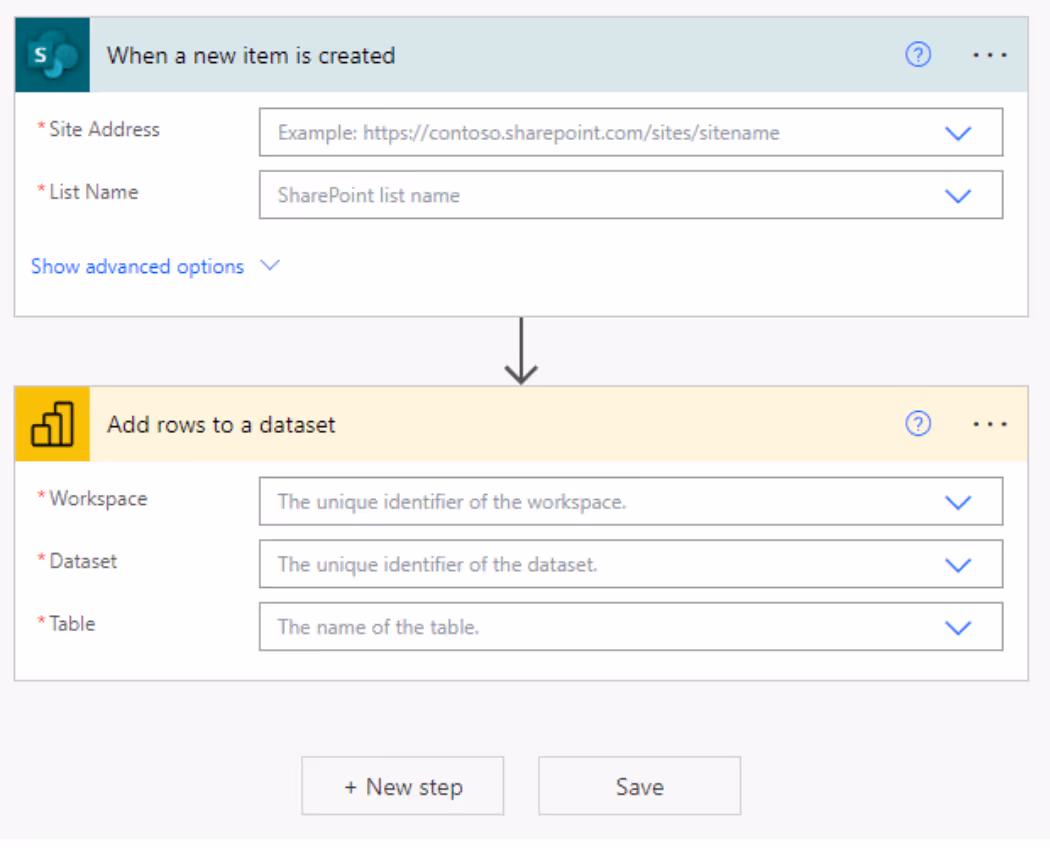
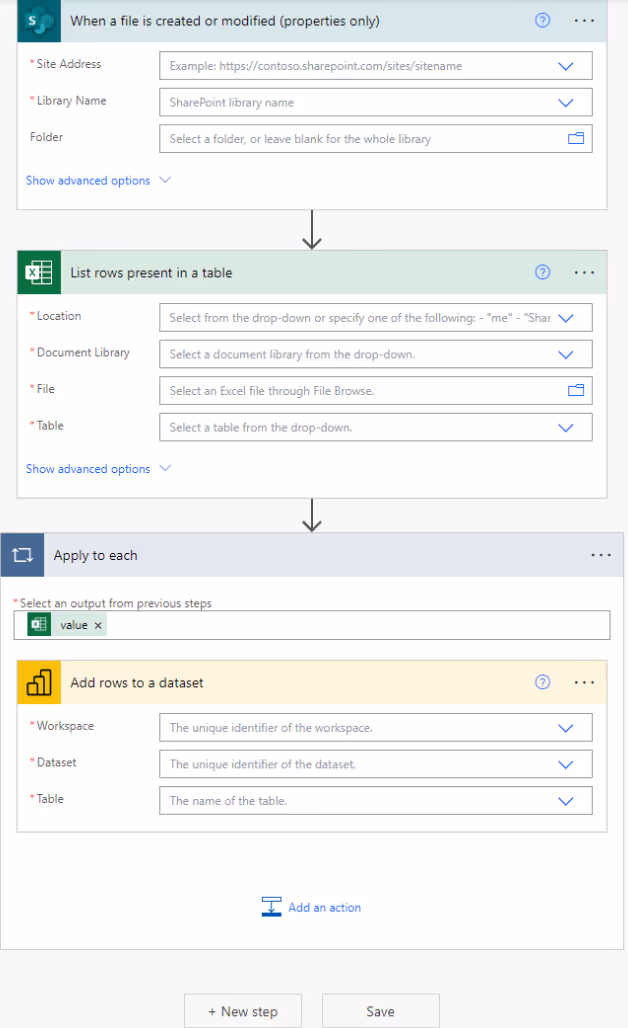
- This seems like it could work for us! Now enter the URL for the relevant SharePoint site and the name of the list you want to track, as well as the info for your destination in Power BI—in this case, the dashboard you just set up. Then click Save.
Let’s try a different search this time. When we plug in “update power bi dataset”, we find another template that could work.
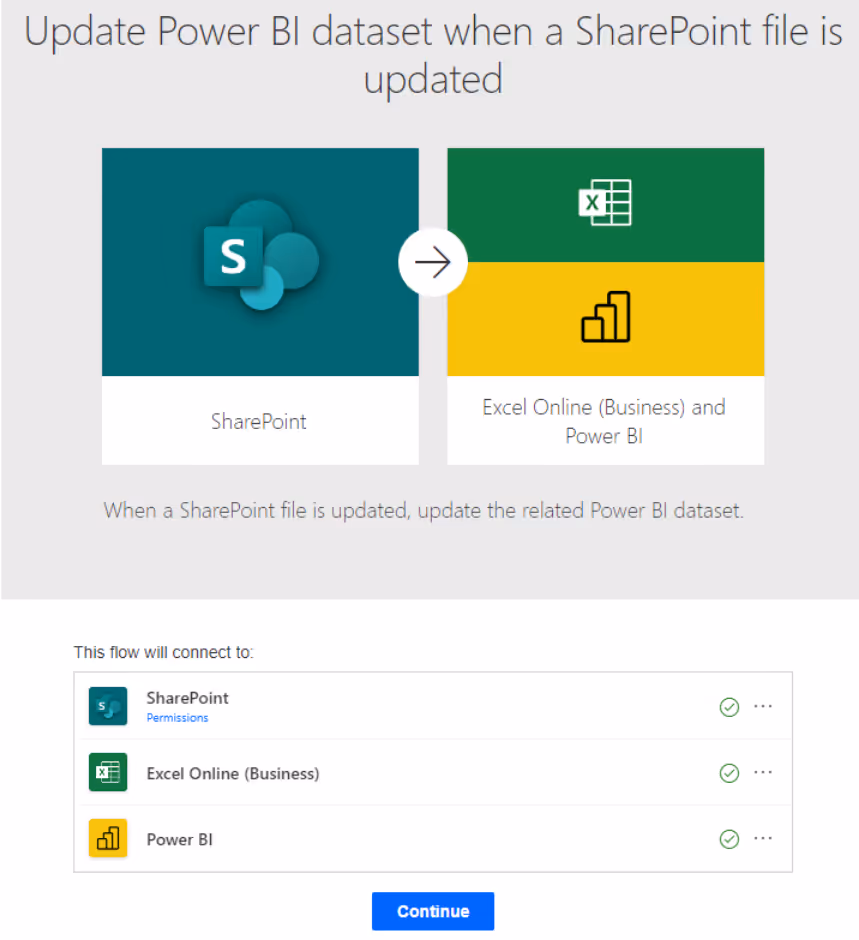
- After you confirm your selection, you can see and customize your flow. Then click Save again.
For step-by-step instructions on creating a flow from scratch, check out the official Microsoft documentation.
Automated Power BI SharePoint reports made easier
All the tools we’ve mentioned offer unique benefits and the true meaningful impact will be seen when you use them together.
- Power BI is a data visualization and reporting tool, which is especially useful for reporting on SharePoint folders and lists regularly.
- Power Automate is a SaaS that automates workflows across a number of applications and services.
- Our SharePoint and Teams monitoring and reporting features complement the regular, out-of-the-box Microsoft reports, giving IT teams full visibility and ultimately helping them move from reactive to proactive management.
When you use these three tools in conjunction with each other, the possibilities are endless.
Gaining optimal visibility of your environment is a top priority to mitigate risk and proactively fix issues—or, ideally, prevent issues from happening in the first place. While Microsoft 365 does offer reporting, its data truly has a chance to shine when you combine it with solutions built to optimize reporting efficiency.
Take your team from reactive to proactive in minutes with ShareGate’s true out-of-the-box Microsoft 365 management solution. Try ShareGate today with a 15-day free trial!


.avif)